CLOSE


IELTS WRITING TASK 1- LINE GRAPH
IELTS WRITING TASK 1- LINE GRAPH
Chủ nhật | 29/08/2021
- Lượt xem: 4921
IELTS WRITING TASK 1- LINE GRAPH
Ms Katherine
I. LINE GRAPH LÀ GÌ
* Biểu đồ line là biểu đồ trong đó chứa một hoặc nhiều đường
* Một đường biểu diễn cho sự thay đổi của 1 yếu tố nào đó qua nhiều mốc thời gian (tuần, tháng, năm ...)
* Ví dụ:
Biểu đồ cho biết số lượng người đi làm trung bình mỗi ngày đi bằng xe hơi, xe buýt hoặc xe lửa từ năm 1970 đến năm 2030.
Biểu đồ thu nhập của 4 shop Cafe tại New York
II. TỪ VỰNG TRONG LINE GRAPH
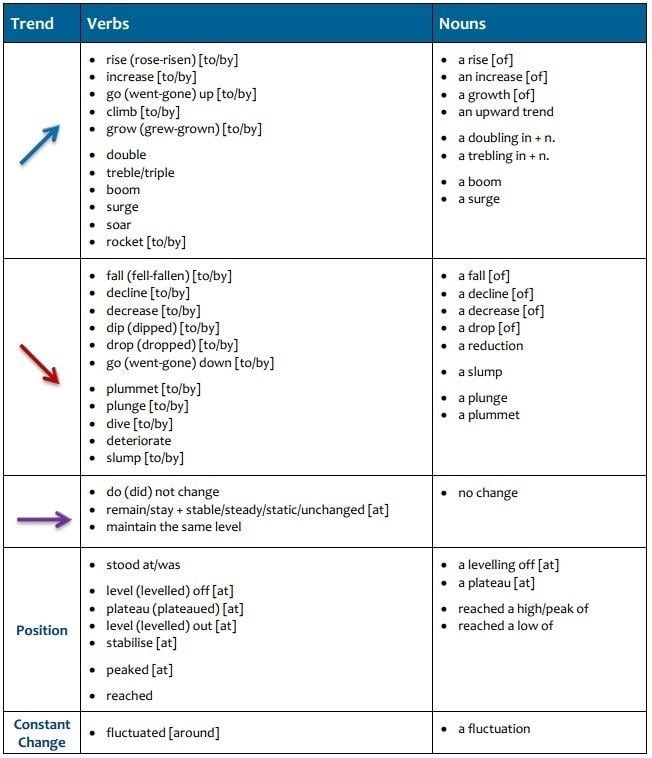
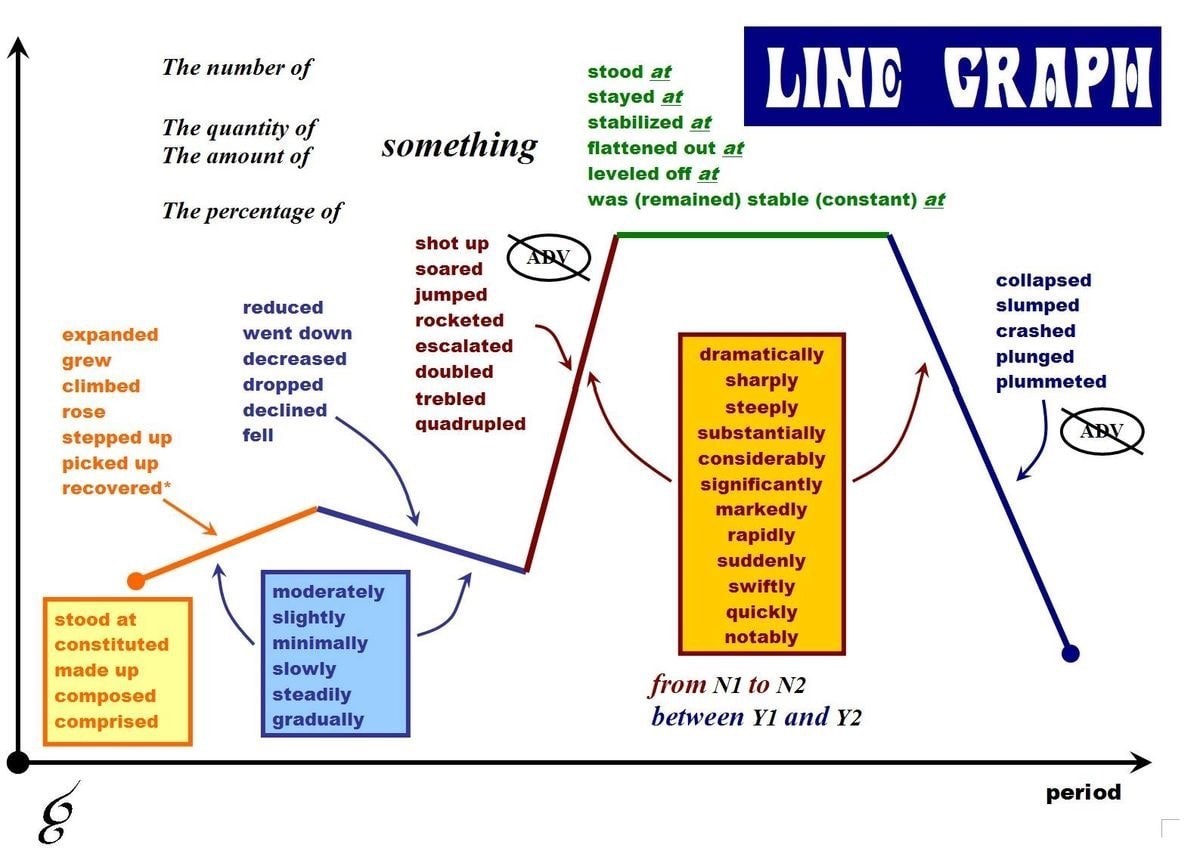
1. Các Động từ và danh từ miêu tả xu hướng
2. Trong 1 biểu đồ:
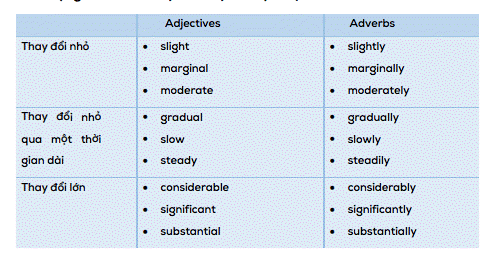
3. Từ vựng miêu tả tốc độ của sự thay đổi
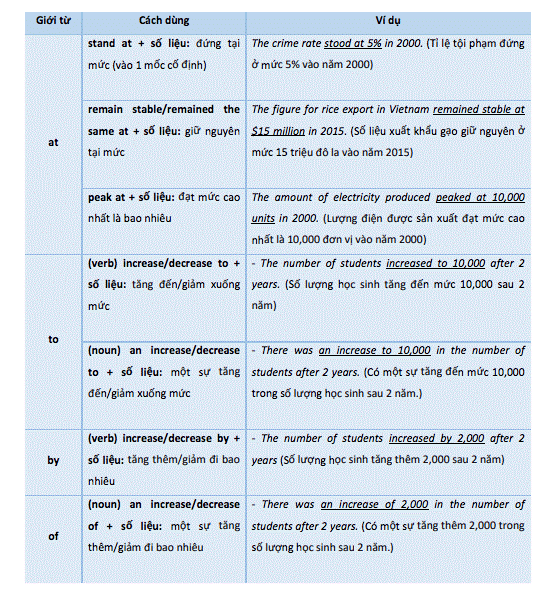
4. Cách sử dụng giới từ trong IELTS WRITING TASK 1 dạng Line graph
5. Từ vựng dự đoán tương lai
* Verbs: predict, expect, forecast, anticipate, project, estimate, evaluate, calculate etc.
* Nouns: prediction, forecast, projection, Expectations, Anticipations, Estimates, Evaluations, Calculations etc.
III. CẤU TRÚC TRONG LINE GRAPH
1. Cấu trúc theo thứ tự thời gian
1.1. As / Whereas/ While X verb, Y verb (at the same time).
While the figure for factories in Japan went up dramatically to 120,000 in 2010, the
quantity in Korea plummeted to 12,000 at the same time.
1.2. Clause, followed by + Noun Phrase
There was a dramatic growth in the number of factories in Japan to 120.000 in 2010,
followed by a sharp decrease to 1,000 in 2015.
There was a considerable increase to 1500 in the number of children doing athletics in
2010, followed by a gradual decrease to 1200 in 2015.
1.3. Clause, prior to/before/after Verb-ing
The number of factories in Japan experienced an increase to 120,000 in 2010,
before hitting a free fall to 1,000 in 2015.
1.4. Clause, after Verb – ing
The figure for factories in Japan hit a free fall to 1,000 in 2o15, after undergoing an
increase to 120,000 in 2010.
1.5. In comparison to/with X, which verb, Y verb.
In comparison with the number of factories in Japan, which witnessed an dramatic
increase to 120,000 in 2010, the quantity in Korea plummeted to 12,000 at this time.
1.6. X verb, Verb-ing, (which verb).
The quantity of factories in Japan went through a period of dramatic increase to 120,000
in 2010, exceeding the number in Korea, which had only 12,000.
people get older.
Just over one fifth of single parents were living in poverty, whereas only 12% of parents living with a partner were classed as poor. The same pattern can be seen for people with no children.
1.9. Các cấu trúc thể hiện thứ tự khác
* Starting / Standing at + số liệu + năm, S+ V +adv
* S + V +adv, Ving, and then V
*Cụm "for most of the period" (dùng cho phần lớn quãng thời gian của biểu đồ (>80%))
* S+V, but later+ V
* Dùng với từ respective/respectively (respectively= correspondingly/in that order/ in the order given
Ví dụ:
+ Only 80 and 30 grams of fish & chips and hamburger were eaten respectively.
(Chỉ có 80 và 30 gram lượng cá và khoai tây chiên cùng với hamburger được ăn tương ứng)
+ The population proportions of China and Japan decreased to 15% and about 2% respectively
(Tỷ lệ dân số của Trung Quốc và Nhật Bản giảm xuống còn 15% và khoảng 2% tương ứng)
+ In 2000, the number of car and train users stood at 3 and 7 million respectively.
(Năm 2000, số người sử dụng xe hơi và xe lửa lần lượt là 3 và 7 triệu)
+ A and B won their first and second prizes respectively
(A và B được hai phần thưởng đầu, A phần thưởng thứ nhất, B phần thưởng thứ hai)
+ Obesity and high blood pressure occurred in 16 percent and 14 percent respectively.
+ By 2010, the respective amounts of carbon emissions from companies A and B had dropped to 8 tonnes and only 3 tonnes.
2. Cấu trúc dự đoán tương lai
2.1. Subject + will + Verb + Object + preposition + time.
Ví dụ: The city will construct a new civic center by 2020.
2.2. According to current + Object (plural), there will be + Subject + preposition + time.
Ví dụ: According to current predictions, there will be a new civic center in the city by 2020.
2.3. According to current + Object (plural), Subject + will + Verb + preposition + time.
Ví dụ: According to current predictions, the city will build a new civic center by 2020.
2.4. It is + past participle + that + Subject + will + Verb + Object + preposition + time.
( It is predicted/forecast/expected/suggested/likely that)
Ví dụ: It is predicted that the city will construct a new civic center by 2020.
2.5. Subject + is/are + past participle + to + Verb ( infinitive) + preposition + time. (… is expected/forecasted/predicted)
Ví dụ: The proportion of the world's population is expected to double between 2016 and 2020.
2.6. Subject + is/are + likely + to + Verb ( infinitive) + preposition + time.
Ví dụ: The proportion of the world's population is likely to double between 2016 and 2020.
2.7. [Predictions/ Expectations/ Anticipations/ Forcasts/ Estimates/ Evaluations/ Calculations] + [show/ reveal/ indicate] + (that) +clause
Ví dụ: Predictions show that it will drop dramatically.
IV. CÁCH VIẾT DẠNG LINE GRAPH
1. Bố cục bài văn IELTS WRITING TASK 1 dạng line graph
Về cơ bản, bố cục bài line graph cũng sẽ giống với bố cục chung của các bài IELTS WRITING TASK 1 cụ thể sẽ như sau:
*Introduction: paraphrase câu đề bài.
+ Viết lại câu của đề bài sử dụng từ vựng của bạn.
* Overview: tìm 2 đặc điểm chung của biểu đồ.
+ Thường với biểu đồ dây có thể lưu ý một số đặc điểm sau để tìm cho nhanh:
+ Đặc điểm về xu hướng: nhìn từ đầu năm đến cuối năm xem xu hướng chung của dây là gì ? Là tăng ? giảm ? hay dao động liên tục ?
+ Đặc điểm về dây nổi bật nhất: ví dụ đề bài cho tầm 3,4 dây -> tìm xem dây nào nằm cao nhất, thấp nhất, hoặc thay đổi lớn nhất..
* 2 đoạn thân bài :
+ 2 khổ thân bài của một bài biểu đồ dây thường sẽ là mô tả số liệu, xu hướng của số liệu.
+ Lưu ý luôn luôn so sánh các thông tin với nhau, không mô tả riêng rẽ, chỉ liệt kê số liệu là không hề ổn
2. Các bước viết dạng Line graph
Bước 1: Phân tích đề . Cần xác định đối tượng (chủ ngữ) của biểu đồ, đơn vị tính, mốc hay khoảng thời gian, số đường có trong biểu đồ, thì của động từ
Bước 2: Paraphrase đề bài - viết mở bài (Introduction)
Viết lại bằng ngôn ngữ, cấu trúc của mình, tránh những từ ngữ đã được đề sử dụng.
Bước 3: Xác định ý và viết nhận định chung (Overview)
Viết xu hướng chung của biểu đồ, không nên nêu những số liệu cụ thể khi viết phần này. Phần này chúng ta sẽ viết 1-2 câu và viết theo 2 ý sau:
+ Đặc điểm về xu hướng: tăng hay giảm? dao động liên tục hay giữ nguyên?
+ Đặc điểm về độ lớn: dây nào, điểm nào cao nhất, thấp nhất, hoặc thay đổi lớn nhất.
Bước 4: Lựa chọn, nhóm thông tin và viết 2 đoạn thân bài (Details)
* Chia theo mốc thời gian
+ Áp dụng cho biểu đồ có 2 hoặc 3 đường để đảm bảo so sánh được các đối tượng với nhau.
+ Có thể phân chia mốc thời gian làm hai phần tương ứng với hai đoạn trong phần thân bài
Detail 1: Miêu tả đầu tiên và điểm giữa
Detail 2: Miêu tả điểm thời gian cuối cùng
* Chia theo đặc điểm về xu hướng
+ Áp dụng cho biểu đồ có 4 đường trở lên
+ Có thể nhóm các đường có chung xu hướng vào 1 đoạn thân bài để khỏi bị rối
Detail 1: Miêu tả các nhóm xu hướng thứ nhất
Detail 2: Miêu tả các nhóm xu hướng thứ hai
Ví dụ 1:
* Subject = Average annual expenditure on cell phone, national and
international fixed-line services
* Unit= $
* Thời gian = 2001 – 2010
* Số đường = 3 đường
* Thì= quá khứ đơn
* Introduction:
* Overview:
It is clear that while the yearly spending on mobile phones increased significantly, the opposite was true for national landline phone expenditure. Also, the figure for international fixed-line service was lowest during the period.
* Details:
Detail 1: (từ 2001 đến 2006)
In 2001, there was an average of nearly $700 spent on national landline phones by US residents, in comparison with only around $200 each on mobile phones and international landline services. Over the next five years, the average amount poured into national
fixed-line phones fell by approximately $200. By contrast, yearly spending on
cell phones witnessed a significant increase of roughly $300. At the same time, the figure for overseas landline services fluctuated slightly below $300.
Detail 2: (từ 2006 đến 2010)
In 2006, US consumers spent the same amount of money on mobile and national fixed-line services, with just over $500 on each. From the year 2006
onwards, it can be seen that the average yearly expenditure on mobile phones surpassed that on national fixed-line phones and mobile phones became the most common means of communication. To be specific, yearly spending on mobile phone services increased to nearly $750 in the last year, while the figure for national landline phone ones decreased to about $400 at the end of the period. During the same period, there was a stability in the figure for overseas phone calls.
Ví dụ 2:
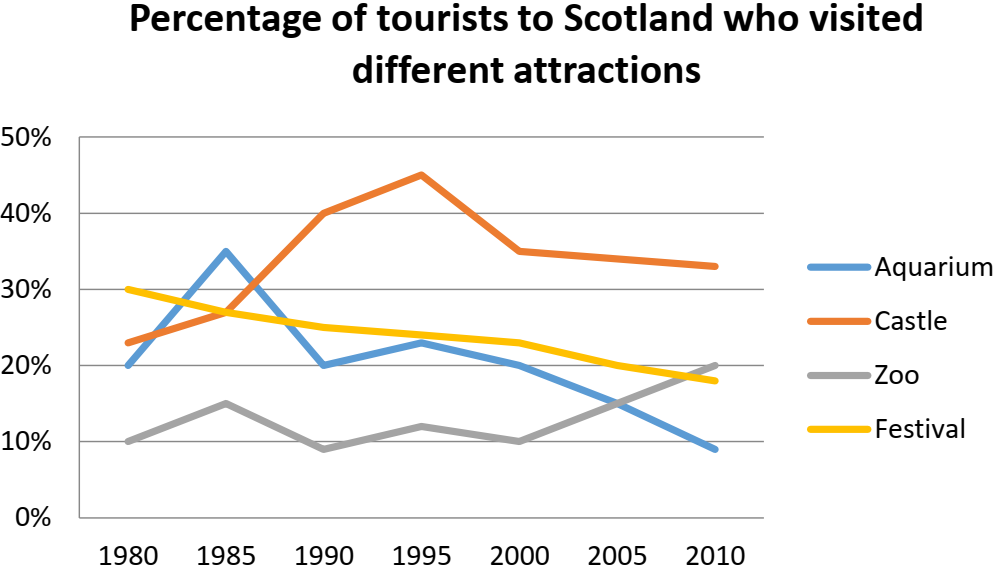
* Subject = percentage of tourists to Scotland
* Unit= percent
* Thời gian = 1980 – 2010
* Số đường = 4 đường
* Thì= quá khứ đơn
* Introduction:

* Overview:
It is clear that while the percentage of tourists visiting Castle and Zoo increased, the opposite was true for Aquarium and Festival over the period. It is also notable that Castle was the most popular tourist attraction in Scotland for most of the period.
* Details:
Detail 1: Castle và Zoo (cùng có xu hướng tăng)
In 1980, the percentage of tourists who chose to visit Castle was nearly 25%, which was significantly higher than the figure for Zoo, at only 10%. Over the following 20 years, the percentage of Castle visitors increased dramatically to reach a peak of about 45% in 1995, followed by a considerable drop to just over 30% in 2010. By contrast, despite some minor fluctuations around 10 to 15% during the first 20 years, the figure for Zoo then significantly increased to 20% in the last year.
Detail 2: Aquarium và Festival (cùng có xu hướng giảm)
Looking at the other attractions, Festival was the most attractive place in Scotland in 1980 with 30% of Scotland tourists choosing this, compared with 20% for Aquarium. Over the next 5 years, the percentage of travellers paying a visit to Aquarium reached a peak of nearly 35% in 1985 before decreasing back to 20% five years later. Since then, this figure continued to fall significantly to just under 10% in 2010. Meanwhile, the percentage of Festival visitors experienced a gradual decrease throughout the period, ending at roughly 25% at the end of the period.
Ms Katherine
I. LINE GRAPH LÀ GÌ
* Biểu đồ line là biểu đồ trong đó chứa một hoặc nhiều đường
* Một đường biểu diễn cho sự thay đổi của 1 yếu tố nào đó qua nhiều mốc thời gian (tuần, tháng, năm ...)
* Ví dụ:
Biểu đồ cho biết số lượng người đi làm trung bình mỗi ngày đi bằng xe hơi, xe buýt hoặc xe lửa từ năm 1970 đến năm 2030.
Biểu đồ thu nhập của 4 shop Cafe tại New York
II. TỪ VỰNG TRONG LINE GRAPH
1. Các Động từ và danh từ miêu tả xu hướng
2. Trong 1 biểu đồ:
3. Từ vựng miêu tả tốc độ của sự thay đổi
4. Cách sử dụng giới từ trong IELTS WRITING TASK 1 dạng Line graph
5. Từ vựng dự đoán tương lai
* Verbs: predict, expect, forecast, anticipate, project, estimate, evaluate, calculate etc.
* Nouns: prediction, forecast, projection, Expectations, Anticipations, Estimates, Evaluations, Calculations etc.
III. CẤU TRÚC TRONG LINE GRAPH
1. Cấu trúc theo thứ tự thời gian
1.1. As / Whereas/ While X verb, Y verb (at the same time).
While the figure for factories in Japan went up dramatically to 120,000 in 2010, the
quantity in Korea plummeted to 12,000 at the same time.
1.2. Clause, followed by + Noun Phrase
There was a dramatic growth in the number of factories in Japan to 120.000 in 2010,
followed by a sharp decrease to 1,000 in 2015.
There was a considerable increase to 1500 in the number of children doing athletics in
2010, followed by a gradual decrease to 1200 in 2015.
1.3. Clause, prior to/before/after Verb-ing
The number of factories in Japan experienced an increase to 120,000 in 2010,
before hitting a free fall to 1,000 in 2015.
1.4. Clause, after Verb – ing
The figure for factories in Japan hit a free fall to 1,000 in 2o15, after undergoing an
increase to 120,000 in 2010.
1.5. In comparison to/with X, which verb, Y verb.
In comparison with the number of factories in Japan, which witnessed an dramatic
increase to 120,000 in 2010, the quantity in Korea plummeted to 12,000 at this time.
1.6. X verb, Verb-ing, (which verb).
The quantity of factories in Japan went through a period of dramatic increase to 120,000
in 2010, exceeding the number in Korea, which had only 12,000.
1.7. The Gap Between + Subject + Narrows/extends +as + clause
The gap between the amount of time spent on watching TV and being online narrows aspeople get older.
1.8. The Same/ Opposite Pattern Can Be Seen For …
Cấu trúc tránh lặp đi lặp lại các cấu trúc quá nhiều lầnJust over one fifth of single parents were living in poverty, whereas only 12% of parents living with a partner were classed as poor. The same pattern can be seen for people with no children.
1.9. Các cấu trúc thể hiện thứ tự khác
* Starting / Standing at + số liệu + năm, S+ V +adv
* S + V +adv, Ving, and then V
*Cụm "for most of the period" (dùng cho phần lớn quãng thời gian của biểu đồ (>80%))
* S+V, but later+ V
* Dùng với từ respective/respectively (respectively= correspondingly/in that order/ in the order given
Ví dụ:
+ Only 80 and 30 grams of fish & chips and hamburger were eaten respectively.
(Chỉ có 80 và 30 gram lượng cá và khoai tây chiên cùng với hamburger được ăn tương ứng)
+ The population proportions of China and Japan decreased to 15% and about 2% respectively
(Tỷ lệ dân số của Trung Quốc và Nhật Bản giảm xuống còn 15% và khoảng 2% tương ứng)
+ In 2000, the number of car and train users stood at 3 and 7 million respectively.
(Năm 2000, số người sử dụng xe hơi và xe lửa lần lượt là 3 và 7 triệu)
+ A and B won their first and second prizes respectively
(A và B được hai phần thưởng đầu, A phần thưởng thứ nhất, B phần thưởng thứ hai)
+ Obesity and high blood pressure occurred in 16 percent and 14 percent respectively.
+ By 2010, the respective amounts of carbon emissions from companies A and B had dropped to 8 tonnes and only 3 tonnes.
2. Cấu trúc dự đoán tương lai
2.1. Subject + will + Verb + Object + preposition + time.
Ví dụ: The city will construct a new civic center by 2020.
2.2. According to current + Object (plural), there will be + Subject + preposition + time.
Ví dụ: According to current predictions, there will be a new civic center in the city by 2020.
2.3. According to current + Object (plural), Subject + will + Verb + preposition + time.
Ví dụ: According to current predictions, the city will build a new civic center by 2020.
2.4. It is + past participle + that + Subject + will + Verb + Object + preposition + time.
( It is predicted/forecast/expected/suggested/likely that)
Ví dụ: It is predicted that the city will construct a new civic center by 2020.
2.5. Subject + is/are + past participle + to + Verb ( infinitive) + preposition + time. (… is expected/forecasted/predicted)
Ví dụ: The proportion of the world's population is expected to double between 2016 and 2020.
2.6. Subject + is/are + likely + to + Verb ( infinitive) + preposition + time.
Ví dụ: The proportion of the world's population is likely to double between 2016 and 2020.
2.7. [Predictions/ Expectations/ Anticipations/ Forcasts/ Estimates/ Evaluations/ Calculations] + [show/ reveal/ indicate] + (that) +clause
Ví dụ: Predictions show that it will drop dramatically.
IV. CÁCH VIẾT DẠNG LINE GRAPH
1. Bố cục bài văn IELTS WRITING TASK 1 dạng line graph
Về cơ bản, bố cục bài line graph cũng sẽ giống với bố cục chung của các bài IELTS WRITING TASK 1 cụ thể sẽ như sau:
*Introduction: paraphrase câu đề bài.
+ Viết lại câu của đề bài sử dụng từ vựng của bạn.
* Overview: tìm 2 đặc điểm chung của biểu đồ.
+ Thường với biểu đồ dây có thể lưu ý một số đặc điểm sau để tìm cho nhanh:
+ Đặc điểm về xu hướng: nhìn từ đầu năm đến cuối năm xem xu hướng chung của dây là gì ? Là tăng ? giảm ? hay dao động liên tục ?
+ Đặc điểm về dây nổi bật nhất: ví dụ đề bài cho tầm 3,4 dây -> tìm xem dây nào nằm cao nhất, thấp nhất, hoặc thay đổi lớn nhất..
* 2 đoạn thân bài :
+ 2 khổ thân bài của một bài biểu đồ dây thường sẽ là mô tả số liệu, xu hướng của số liệu.
+ Lưu ý luôn luôn so sánh các thông tin với nhau, không mô tả riêng rẽ, chỉ liệt kê số liệu là không hề ổn
2. Các bước viết dạng Line graph
Bước 1: Phân tích đề . Cần xác định đối tượng (chủ ngữ) của biểu đồ, đơn vị tính, mốc hay khoảng thời gian, số đường có trong biểu đồ, thì của động từ
Bước 2: Paraphrase đề bài - viết mở bài (Introduction)
Viết lại bằng ngôn ngữ, cấu trúc của mình, tránh những từ ngữ đã được đề sử dụng.
Bước 3: Xác định ý và viết nhận định chung (Overview)
Viết xu hướng chung của biểu đồ, không nên nêu những số liệu cụ thể khi viết phần này. Phần này chúng ta sẽ viết 1-2 câu và viết theo 2 ý sau:
+ Đặc điểm về xu hướng: tăng hay giảm? dao động liên tục hay giữ nguyên?
+ Đặc điểm về độ lớn: dây nào, điểm nào cao nhất, thấp nhất, hoặc thay đổi lớn nhất.
Bước 4: Lựa chọn, nhóm thông tin và viết 2 đoạn thân bài (Details)
* Chia theo mốc thời gian
+ Áp dụng cho biểu đồ có 2 hoặc 3 đường để đảm bảo so sánh được các đối tượng với nhau.
+ Có thể phân chia mốc thời gian làm hai phần tương ứng với hai đoạn trong phần thân bài
Detail 1: Miêu tả đầu tiên và điểm giữa
Detail 2: Miêu tả điểm thời gian cuối cùng
* Chia theo đặc điểm về xu hướng
+ Áp dụng cho biểu đồ có 4 đường trở lên
+ Có thể nhóm các đường có chung xu hướng vào 1 đoạn thân bài để khỏi bị rối
Detail 1: Miêu tả các nhóm xu hướng thứ nhất
Detail 2: Miêu tả các nhóm xu hướng thứ hai
Ví dụ 1:
* Subject = Average annual expenditure on cell phone, national and
international fixed-line services
* Unit= $
* Thời gian = 2001 – 2010
* Số đường = 3 đường
* Thì= quá khứ đơn
* Introduction:
* Overview:
It is clear that while the yearly spending on mobile phones increased significantly, the opposite was true for national landline phone expenditure. Also, the figure for international fixed-line service was lowest during the period.
* Details:
Detail 1: (từ 2001 đến 2006)
In 2001, there was an average of nearly $700 spent on national landline phones by US residents, in comparison with only around $200 each on mobile phones and international landline services. Over the next five years, the average amount poured into national
fixed-line phones fell by approximately $200. By contrast, yearly spending on
cell phones witnessed a significant increase of roughly $300. At the same time, the figure for overseas landline services fluctuated slightly below $300.
Detail 2: (từ 2006 đến 2010)
In 2006, US consumers spent the same amount of money on mobile and national fixed-line services, with just over $500 on each. From the year 2006
onwards, it can be seen that the average yearly expenditure on mobile phones surpassed that on national fixed-line phones and mobile phones became the most common means of communication. To be specific, yearly spending on mobile phone services increased to nearly $750 in the last year, while the figure for national landline phone ones decreased to about $400 at the end of the period. During the same period, there was a stability in the figure for overseas phone calls.
Ví dụ 2:
* Subject = percentage of tourists to Scotland
* Unit= percent
* Thời gian = 1980 – 2010
* Số đường = 4 đường
* Thì= quá khứ đơn
* Introduction:
* Overview:
It is clear that while the percentage of tourists visiting Castle and Zoo increased, the opposite was true for Aquarium and Festival over the period. It is also notable that Castle was the most popular tourist attraction in Scotland for most of the period.
* Details:
Detail 1: Castle và Zoo (cùng có xu hướng tăng)
In 1980, the percentage of tourists who chose to visit Castle was nearly 25%, which was significantly higher than the figure for Zoo, at only 10%. Over the following 20 years, the percentage of Castle visitors increased dramatically to reach a peak of about 45% in 1995, followed by a considerable drop to just over 30% in 2010. By contrast, despite some minor fluctuations around 10 to 15% during the first 20 years, the figure for Zoo then significantly increased to 20% in the last year.
Detail 2: Aquarium và Festival (cùng có xu hướng giảm)
Looking at the other attractions, Festival was the most attractive place in Scotland in 1980 with 30% of Scotland tourists choosing this, compared with 20% for Aquarium. Over the next 5 years, the percentage of travellers paying a visit to Aquarium reached a peak of nearly 35% in 1985 before decreasing back to 20% five years later. Since then, this figure continued to fall significantly to just under 10% in 2010. Meanwhile, the percentage of Festival visitors experienced a gradual decrease throughout the period, ending at roughly 25% at the end of the period.